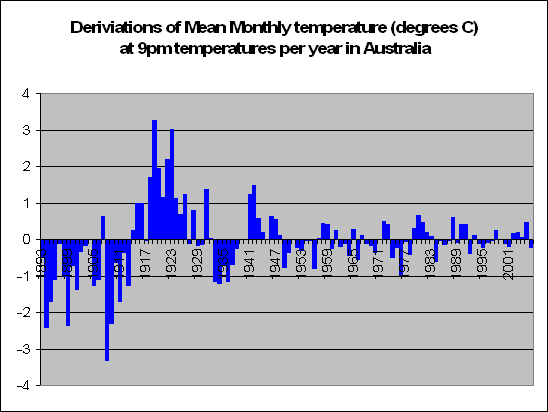
 9pm. Ok the graph on the left has all the deviations from the norm of temperatures recorded at 9pm. What we can obviously see at the start is big negative deviations up until abut 1915 and then big positive deviations till about 1930, then smaller negative, smaller positive. Hmm. We will talk about accuracy of data later on, but it seems there is a lot more variability in the earlier recordings.
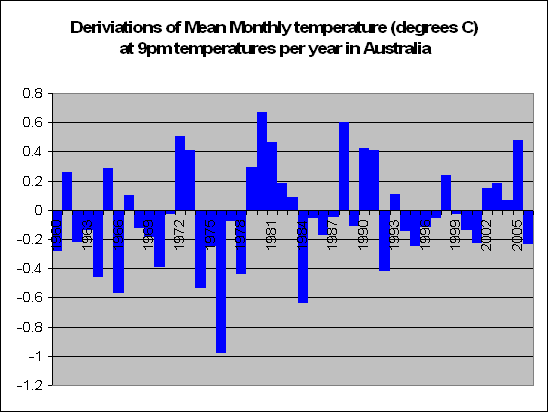
 Therefore the graph now on the left has deviations from temperatures at 9pm from 1960 onwards. Can you see a pattern? I can’t. Couple of cold years, couple of warm. In the end we have to conclude that there is no statistical evidence that Australia is warmer or colder than it was 60 years ago at 9pm (F = 1.50, p = 0.227).
 So therefore is Australia hotter now at 9am than it was in the past? No. Is Australia hotter now at 3pm than it was at the past? Hmm…No. Is Australia hotter now at 9pm than it was in the past? Hmm…still no. So when, if any was Australia actually hotter? We’ll have a look at 3am on Wednesday.
3 comments:
I'm interested in how you're calculating your averages - specifically:
- are you combining your stations into a national value using a straight arithmetic mean, or some kind of area-weighted average?
- are you calculating differences from normal for each station and then averaging those values across Australia, or averaging the temperatures across Australia and then calculating a difference from normal for that value?
Well Jonathan all I was going to say was that my horses are STILL running....then I read curious's post...
Hi curious,
the details of the analysis and how it's performed is given here: http://gustofhotair.blogspot.com/2006/11/analysis.html
if you have any other questions apart from what is there, then please ask. That should answer your questions.
Cheers
Post a Comment