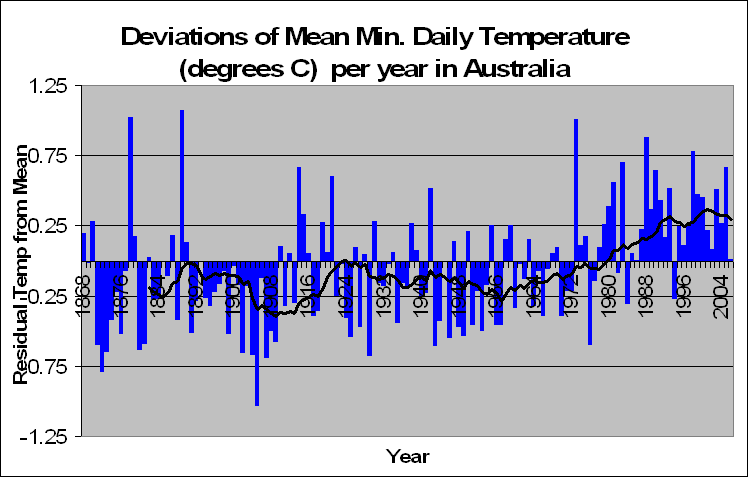
Given on the left is the average monthly Minimum temperature deviations from the norm. We had some pretty freezing nights from 1870 to 1910 and some pretty average nights up until the mid 1970s. After that the minimum time shot up about 0.27 degrees until now.
Global Warming advocates will prove this as evidence for global warming, and indeed it does look as though Australia’s minimum temperatures are in fact warming up. What is interesting (despite the moving average), of the sudden increase in temperature at the mid 1970s. From 1970 to current, there has been no statistically significant increase in temperature (F = 0.87, p = 0.357). This might well be because the data set of 30 years is pretty small, but it also might be because the average monthly minimum temperature in Australia is not increasing from when it shot up in the mid 1970s. Whether or not increased night temperatures will have any influence on crops and all the problems that global warming alarmists say, I’m not sure. But personally I welcome a warmer night, well as long as I don’t live near the equator!
We will go more in depth, looking at states, and individual stations with regards to the mean monthly maximum and minimum graphs given here. But firstly I want to ask you, despite these two graphs, and the fact that these are the same and only types of graphs that the ABM use to prove an increase in temperature, are these the correct way to see if Australia is warming up?
Most people would say yes, what are the other options? Well let me give you an example. Suppose we wanted to compare two days and see which one was hotter. We take temperature readings every hour. We could compare the two smallest minimum temperatures readings and the two maximum temperature readings to see which is hotter. Or we could compare what the temperature was at the same time of the day between the two. Eg, which day was hotter at 3pm, and at 9am, and at 1pm?
If we keep the variable constant as to the time that we take the measurements, then we will get a lot better understanding as to which day was actually hotter. Can we do this with Australian temperature data? You bet.
3 comments:
Well done again Jonathon. Keep up the good work.
Michael R
Hey Jonathan,
Very interesting reading. I look forward to getting on here each night. I am still laughing about Niagara Falls and the lack of mist. It sure wasn't lacking any when I was there a few years ago...Hope you don't mind but I mentioned it on Andrew Bolts blog this morning..although I did give you credit. I'm looking forward to your analysis of the temps in Australia. Keep up the great work.
Cheers
Yes I noticed that dazza. I'm very happy for you to advertise my blog! But make sure you link the site ;)
Thanks for your kind words
Post a Comment