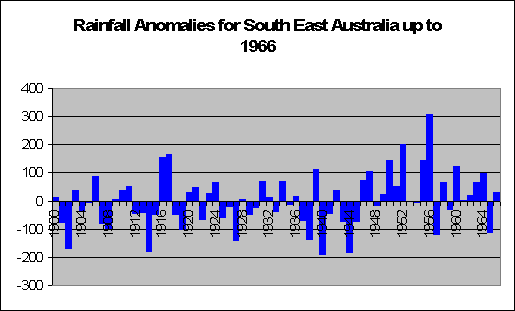
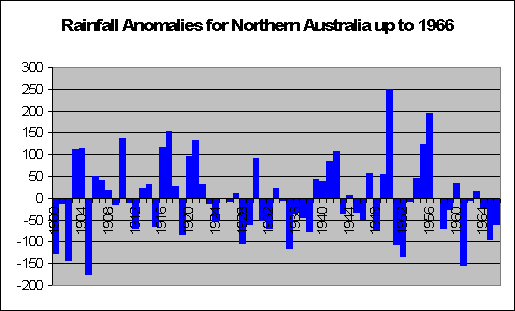
The graph below shows what is happening in northern
Gust of Hot Air is a blog outlining my own statistical analysis of Australian Weather. I am Jonathan Lowe, and have completed by Bsc(hons) in statistical analysis as well as my Master of Science. I have done 2 years of my PhD There is a lot of statistical information regarding climate change and I intend to provide statistical analysis into the area to prove if the recent well advertised rise in temperature is at all statistically significant. Results will be uploaded here on a regular basis
Wednesday, February 14, 2007
Global Warming Trends in 1966
Lets time warp ourselves back to 1966. Australian Politician Robert Menzies resigns, the Soviet Luna 9 spacecraft makes the first controlled rocket-assisted landing on the moon, Australia
Subscribe to:
Post Comments (Atom)


2 comments:
"There will never be any water shortages in southern Australia because the rainfall there is increasing every year."
Tell that to a South Australian. The rainfall across South Australia this past winter was some of the lowest on record...
For Australia generally: The SE corner may be getting wetter, but the farmers will tell you it doesn't get very far inland. And the Northern areas... what is counted in this region? Are the monsoons dropping less rain on the Top End?
Western NSW is one of the worst hit areas (along with most of SA). Why then are many farmers still irrigating with open ditches, instead of pipes? Why do some persist with flood irrigation for rice production? And the clearing of land for mono-cropping of, say, wheat, is leaving the soil less fertile and more saline every year.
To quote your words again: "this could be a major problem for the next generation". Weather and climate aside, farming practices aren't suited to the conditions. As conditions change, that disparity will grow and things really will start looking grim.
Nice steve m, but you might have missed the point of the article. It was indending to me made at 1966 and looking at the trends occuring then and then forecasting what will happen in the future, which is exactly the opposite of what it happening now. In other words, natural variation has a lot to do with it.
Post a Comment