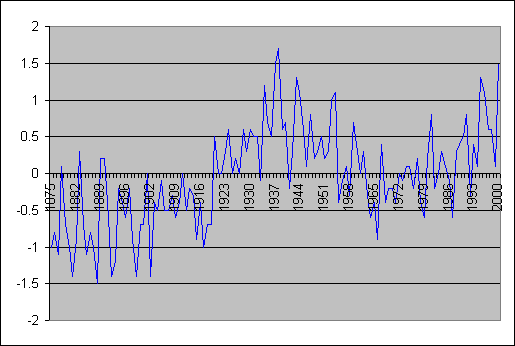
Associated with the LFO, SAT record shows two periods of highest temperatures in the Arctic: in the 1930-40s, and in recent decades. In contrast to the global and hemispheric temperature, the maritime arctic temperature was higher in the late 1930s-early 1940s than in the 1980-90s.
A graph of their analysis is shown below:

Well despite the warmth of the 1930s the arctic ice sheets failed to melt away, and my city isn't under 20 feet of water due to increased sea level rises. Thank godness for that, I can now rest in peace.
4 comments:
I have a post showing how the Hadley Centre, now the compiler of the HadCRUT3 global T data so much quoted by the IPCC, has actually discarded many of the CRU high north latitude, high warming grid cells. See my page comparing global T anomaly maps for 2005 linked at my Blog page.
http://www.warwickhughes.com/blog/?p=82
Much work still to be done to track down exactly what Hadley have done to compensate for this loss of warming trend.
yes very interesting website Warwick (and also thanks for the cross link). I will be following up more on this soon when I get my programs back together that I lost on my hard disk stuff up
Hi Jonathan,
If people are so worried about rising sea levels how come sea frontage property is still so expensive?
Interesting site too Warwick.
Cheers
As we know, in 1939/40 started a global cooling that lasted for 4 decades. What lead to this? Is there a pattern in climate change?
You can see here the whole story of the winter of 1939.
Post a Comment