In fact, the ABM actually agree with us as well:
http://www.bom.gov.au/lam/climate/levelthree/climch/clichv4.htm
Because of the large year-to-year changes it is hard to detect any long-term trends in Australian rainfall.
But continue on saying:
However, some weak trends in rainfall have been identified. The percentage area of Australia experiencing extreme wet conditions has increased slightly this century while the area of extreme dryness has reduced.
Ahh, so despite the fact that global warming isn’t making Australia dryer, it’s climate change that is making the dryer places more dry and the wetter places more wet. Now we get you. So where’s the proof of this? Hmm…looks like there is none. If I remember correctly, their “weak trend” in regards to cyclones was proven non significant.
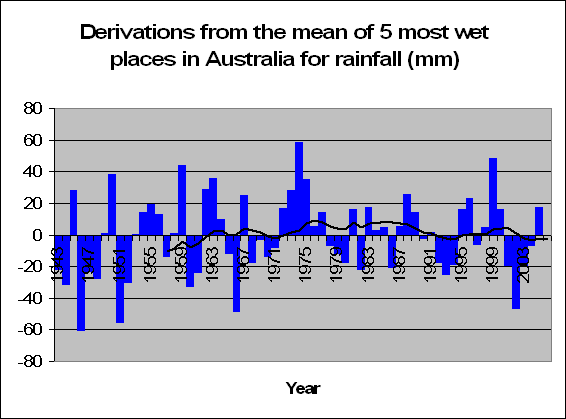
So where’s the proof of this? ABM don’t provide it, but using their own statistics, I decided to test it. From our sample we took the 5 most driest places in Australia, and the 5 most wet. These were as follows:
Most driest: MARREE (SA), WOOMERA (SA), CARNARVON (WA), TIBOOBURRA (NSW), MEEKATHARRA (WA).
Heard of them? No, that’s why no one lives there. There’s no water to flush the toilet.
Most Wet: COFFS HARBOUR (NSW), DARWIN (NT), BYRON BAY (NSW), THREDBO (NSW), CAIRNS (QLD).
Great places to Ski, surf, and well, wrestle with crocodiles.


And the results are the following two graphs for the most driest and most wet. To be honest. I can’t see any pattern whatsoever. But let’s test it anyway. Tests prove, that there is no significant increase or decrease in rainfall in the 5 most wet places in Australia (F = 0.66, p = 0.421) and there is also no significant increase or decrease in the amount of rainfall in the 5 driest places in Australia either (F = 1.37, p = 0.244).
So how did the ABM come to these conclusions that the dry is drying up and the wet is wetting up? Either they have terrible statisticians working for them (lets hope not), or they want to prove that climate change is, in fact, changing. I mean, there’s so much hype about it recently, that it’s possibly in the ABM’s best interests to prove that their work is ultra-important.
So why not claim that Australia’s rainfall patterns are changing more recently? Why not claim that because of this global warming results and humans are to blame? Why not claim that we have to act now or human civilization will be lost forever?
Why not? Because it all, quite possibly, could not be true.
10 comments:
Hang in there Australia.
Looks to me like no matter what climate trend comes to pass where you live or anybody else lives, environmental whackos conveniently have a scenario worked out that pinpoints it being man made global warming as its cause. Hell they even got colder winters as caused by global warming!
When was the last time a major science discovery or initiative was pushed down peoples throat by politicians? Politicians like Al Gore who claim the premise of man made global warming is "undebateable, settled, completely scientifically explained". Yeah right.
These nut jobs want government funding of university research (which means higher taxes)and will tell any lies they need to get it. Dont buy their crap. Most of America is on your side!
I like your analysis. So global warming and rain are not related? Interesting. What about temperature increases in Australia?
Well, we can't say that global warming and rain are not related, but we can say that despite the hype of global warming, rain levels are not decreasing. I have done some analysis into the relationship between temperature and rain, and I have also done some much detailed analysis into temperatures in Australia which will provide startling results. These will be uploaded on the blog in due time soon.
Jonathan,
Might I ask if the listed email is accurate?
Richard
Keep up the great work Jonathan. I rally am looking forward to your research. I will be intently logging on in the future.
Cheers
Dazza
Thanks Dazza, and Richard Sheehan, yes the listed email for myself is correct.
Hi Jonathon,
A suggestion for you. We need a comprehensive examination of Australia's temperature record to see the statistical relevance of any rise in recorded temperatures say over the last one hundred years. But we need to rule out any place that could be subject to the ""Heat-Island effect"" ( I'm sure you would have heard of this). You need to find weather recording stations in rural locations wel away from any possible heat contamination from development etc. Are there enough weather stations to get any meaningful statistical data?
Don't worry there,
I have done plenty of analysis with temperatures in Australia, and have accounted for the urban heat or heat island effect. There are enough stations, and although I don't want to release all my killer analysis at once, I will say that I do have enough evidence to prove that there has been minimal or no signifiant increase of temperature in Australia. But as I said, this info will come soon, very soon....
What would be remarkable is if temperatures were not gradually heading in one direction or another. Hey its a planets climate. Constant change is the norm.
So we have a scenario to spend trillions of dollars and it might take 500 years to tell if this warming is just a blip or an actual man made event? Thats pretty darn convenient for politicians held to a term limit called "their lives"!
Well I have good evidence that there is constant temperature, at least in Australia....thing is, because we only have limited data, it's so easy to manipulate to come to the conclusion that we are increasing in temperature. The ABM are doing that exactly, showing only graphs from 1910 when records go back to the mid 1800's
Post a Comment