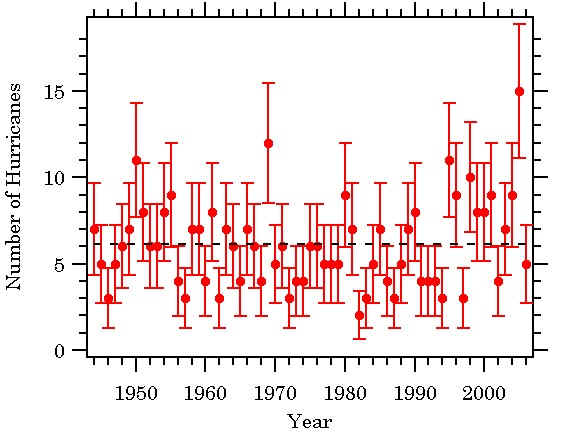
The annual hurricane counts from 1945 through 2006 are 100% compatible with a random Poisson process with a mean of 6.1 hurricanes per year. The trends and groupings seen in Figure 1 are due to random fluctuations and nothing more.
Whilst many reading this won't know what a Poisson distribution is, they are often used to measure a variable that never goes negative and has a relatively constant skewed normal distribution with sparatic big values, like for example, the total goals scored in a soccer game.
His analysis into the yearly North Atlantic hurricane counts from 1945 to 2004 as shown below lead him to conclude that
There is no obvious long term trend anywhere in the plot.

3 comments:
100% compatible?? And I thought this was about good statistics. Ever heard of a confidence limit? Or a test statistic?
Having looked at the histogram on Climate Audit it does look reasonably Poisson. I suspect that a chi-square test would be useful in quantifying the agreement. Hang on, you'd have to combine most of the bins to make it meaningful... (Kolmogorov-Smirnov may have sufficient sensitivity as it isn't binned.)
Really, all you can say here is that the plots look similar. As a number of comments have pointed out on Climate Audit, this doesn't say anything about a trend, or lack thereof. So I agree, in part, there is no OBVIOUS long term trend in that plot. It doesn't mean it's not driven. Nor does it mean there is no trend. Is this blog about critical examination of data, or parroting a selection of climate-change skeptic websites?
oh I agree with you completly on this one Steve M. In saying 100% compatable, you would think that there is no error whatsoever, hardly science. Perhaps a more interesting stance on hurricanes and more scientific is here: http://www.worldclimatereport.com/index.php/2006/11/29/hurricane-update-again/
or here http://www.worldclimatereport.com/index.php/2006/11/09/not-quiet-on-the-hurricane-front/#more-186
Why shouldn't it be consistent with a Poisson regression? I'm not sure what that's supposed to demonstrate.
Either way, I've run a residual correlation analysis of number of named storms and temperature. This analysis basically controls for possibly coincidental trends. There's an undeniable correlation. You're welcome to comment on it.
Post a Comment